
An MCP server can look healthy in a terminal and still fail the moment a client tries to use it. Sometimes the process exits before the first request. Sometimes the client connects but sees no tools. And sometimes a tool appears correctly, only to fail when it receives a real argument.
Each failure happens at a different boundary. Treating them all as “MCP is broken” usually leads to changing the wrong thing. MCP Inspector helps you narrow the failure down before involving an AI agent or your full application.
The first task is to identify where the connection stops working: process launch, transport, tool discovery, argument validation, or the application behind the tool. The commands below follow the October 2026 Inspector documentation. They are reproducible command patterns, not claims of a live test against a third-party server.
What Inspector actually checks
MCP Inspector is the reference testing and debugging client for Model Context Protocol servers. It provides a browser interface, a command-line client, and a terminal interface. The same underlying client can connect to a locally launched server or a remote MCP endpoint. That matters because a problem reproduced outside your AI app is easier to isolate: you can inspect the server and protocol boundary before debugging model decisions.
For a local stdio server, the client launches a process and communicates through its standard input and output. For a remote service, it connects over the supported HTTP transport. In both cases, a usable connection is only the first milestone. You still need to discover the available tools, inspect their input schemas, call one with valid input, and check the actual result.
A server that lists tools but returns errors on every call is not operational merely because its connection badge turns green.
Connect to the server you actually run
Before opening Inspector, confirm how the server is started. A Node server may require a build step; a Python server may require a virtual environment. The executable, working directory, environment variables, and endpoint must match the server's own documentation.
For a local Node server with an existing compiled entry point, the official Inspector quick-start pattern is:
npx @modelcontextprotocol/inspector node ./dist/server.js
The browser interface launches with a per-run access token in its URL. Keep that URL private. Running Inspector without a server command also allows you to choose a target from its interface:
npx @modelcontextprotocol/inspector
On the current v2 Inspector line, Node 22.19.0 or later is required. If the command fails immediately with an engine or runtime error, check the Node version before diagnosing the MCP server. This requirement belongs to the Inspector itself, not to every MCP implementation.
For a remote server, follow the documented server-URL and HTTP transport options rather than trying to run the remote URL as an executable. Confirm the exact endpoint path, including a suffix such as /mcp where the provider uses one. A correct domain with the wrong path can still return a perfectly ordinary HTTP 404.
Trace the failure through four boundaries
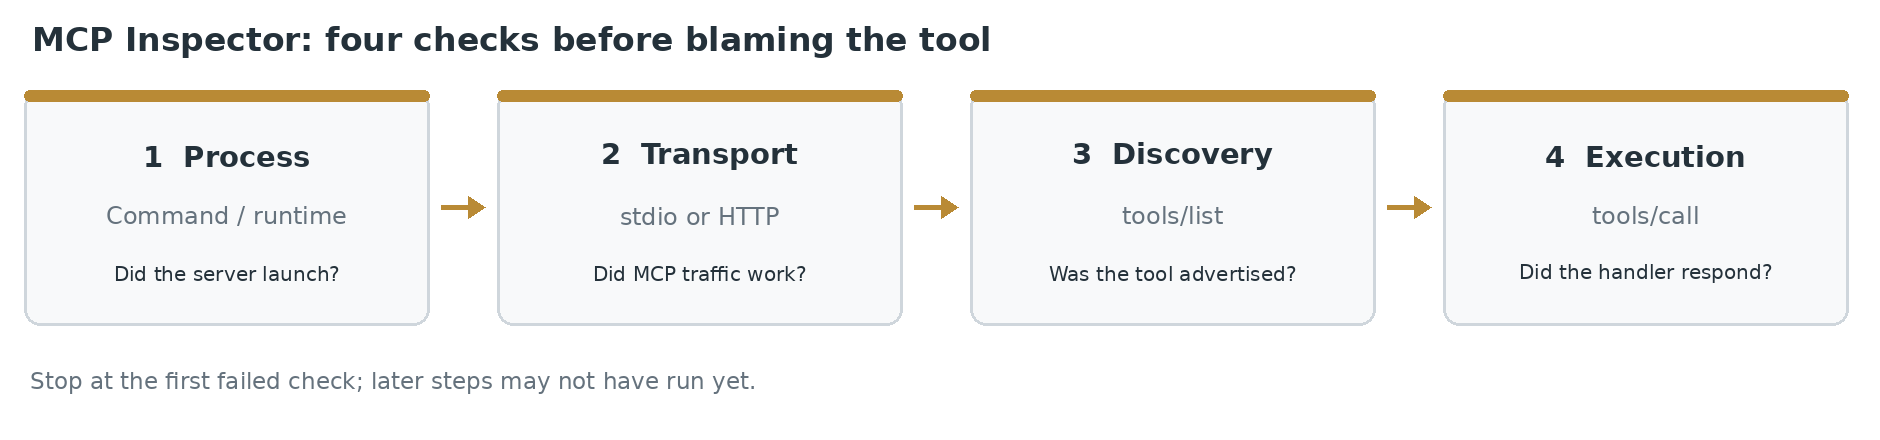
1. Did the server process start?
A local server that never launches cannot answer MCP requests. Check the executable name, file path, dependencies, configuration file, and required environment variables. A relative path such as ./dist/server.js is resolved from the working directory; the same command can work in one folder and fail in another.
For stdio servers, application logs must not be written to protocol stdout. A stray console.log('server ready') can corrupt the message stream. Send diagnostics to stderr instead. This is an easy mistake when reusing a development server that was originally written for ordinary terminal use.
What to look for: a process exit, a module-not-found error, malformed protocol traffic, or unexpected text before the first MCP response. Do not “fix” this by changing tool schemas; tool discovery has not started yet.
2. Did the transport and protocol version agree?
The transport is not interchangeable with the protocol lifecycle. An HTTP MCP endpoint and a stdio executable have different startup paths. Likewise, modern MCP and legacy versions can negotiate differently.
The July 28, 2026 MCP specification introduces a stateless core and a different discovery lifecycle. Older versions use an initialize handshake; modern requests use their own version context. A mismatch can look like a generic connection failure even when the endpoint is reachable.
Check which protocol era your client and server support, then inspect the earliest successful or failing exchange. Do not assume that an error mentioning initialization always indicates a broken server: you may be pointing a client built for one era at a server built for another.
3. Can the client list the tools?
Once connected, request tools/list. Inspector's CLI can make this a repeatable check:
npx @modelcontextprotocol/inspector --cli node ./dist/server.js --method tools/list
Replace the process command with the one your server actually uses. A successful tool list tells you the server advertised its tools. It does not verify that their handlers work, that permissions are sufficient, or that results are safe for a calling application.
If the tool you expect is missing, check registration order, configuration, permission filtering, and whether you connected to the intended server. If the list is empty, compare the server's startup logs with its registration path before changing client-side prompts.
4. Can one tool complete a call?
Choose a read-only tool whose input you understand. Inspect its declared argument names, required fields, types, and result format. Call it with a deliberately small, valid input. Then try one invalid input to check the error message.
Suppose a fictional server advertises lookup_ticket with a required string field called ticket_id. The following payload is an illustrative schema-shaped input, not a verified response from a real service:
{"ticket_id":"TICKET-104"}
A call using {"id":104} can fail even if the server is healthy: it changes both the field name and type. If a valid call still fails, investigate the handler, backing API permissions, network access, and downstream dependency separately from protocol setup.
Two failures that look alike in the client but aren't
Example: connection closes before tool discovery. A developer runs a compiled Node MCP server locally. Inspector opens, yet the connection closes before any tools appear. Its server log contains Cannot find module './dist/server.js'. The executable path has failed; the model, tool schemas, and OAuth permissions have not entered the picture. Confirm that the compiled file exists and that Inspector was launched from the intended working directory. Rebuilding may solve the missing-file problem, but only if the server's build actually produces that path.
Now consider a different local failure. The server process stays alive but prints Server listening to stdout before emitting protocol messages. Inspector may receive that plain text where it expects MCP traffic. Moving the diagnostic message to stderr keeps the stdio protocol channel clean. Hiding the error by increasing a timeout or changing an unrelated endpoint will not repair it.
Example: an HTTP endpoint answers, but it is not your MCP endpoint. A developer enters https://example.com instead of the documented path https://example.com/mcp. The server responds with a branded HTML page or a 404. That proves that some HTTP service answered; it does not prove MCP routing worked. Check the endpoint path, transport selection, Content-Type, reverse-proxy forwarding, and gateway logs before investigating tool registration.
If the endpoint returns a 401 challenge, pause the connection investigation and inspect authentication discovery. A protected endpoint refusing an unauthenticated request may be behaving correctly. Repairing authorization by disabling it would turn a configuration fault into a security regression.
Read the symptom before choosing a fix
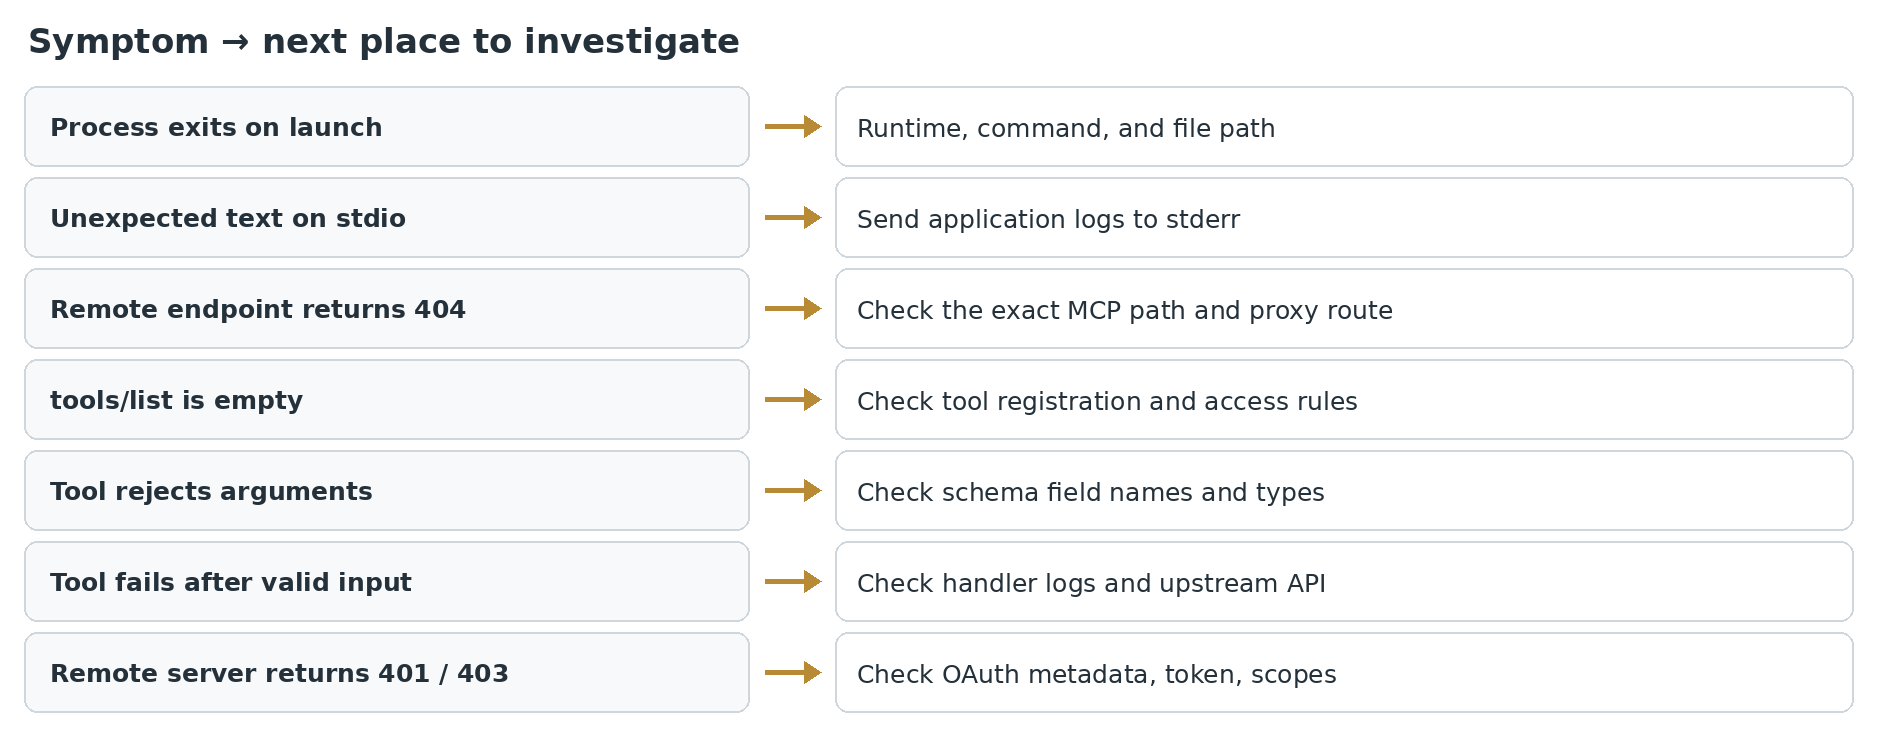
| What you observe | More likely boundary | Next useful check |
|---|---|---|
| Inspector exits before opening | Local runtime or launcher | Node version, command, file path |
| Local connection fails with unexpected text | Stdio transport | Remove logs from stdout |
| Remote endpoint returns 404 | URL or routing | Exact MCP path and proxy route |
| Connection opens; tool list is empty | Tool registration or authorization | Inspect registered tools and scopes |
| Tool is listed; call rejects arguments | Input schema | Match required names and types |
| Tool call fails after accepted input | Handler or dependency | Server logs, upstream status, credentials |
| 401 or 403 from a remote server | Authorization | Resource metadata, token, scopes |
These are diagnostic directions, not one-to-one diagnoses. For example, a 404 may also be returned deliberately by an access gateway. Use the response headers and server logs to confirm the actual source.
A useful separation: protocol error versus application error
Imagine a server can list get_inventory, but a call returns “warehouse API timeout.” The MCP protocol may have done its job: the transport worked, the tool was discovered, and the input reached the handler. A proxy timeout or database outage now belongs to the downstream application boundary.
The reverse also happens. Your warehouse API may be reachable from a terminal while Inspector cannot discover the tool because the MCP server never registered it. Debugging the warehouse API again won't make the tool appear.
This separation saves time: verify startup, connection, discovery, call validation, and downstream execution in that order. Stop at the first boundary that fails.
A repeatable check for a single tool
After tools/list displays the expected tool, use a small call that cannot change production data. For an illustrative read-only lookup_ticket tool that expects a ticket_id string, the current Inspector CLI supports this invocation:
npx @modelcontextprotocol/inspector --cli node ./dist/server.js --method tools/call --tool-name lookup_ticket --tool-arg ticket_id=TICKET-104 --format json
The command is only meaningful if your own server actually exports a tool with that name and schema. A successful transport response is not sufficient if the tool result reports an error. Inspector v2 uses a non-zero exit status for a tool execution failure, which matters in automated checks: a script must not report green merely because it received JSON.
Repeat the call with a deliberately incorrect field, such as id instead of ticket_id. You want a clear validation error that names the missing required field. Then repeat with a ticket identifier that your backing service cannot find. Those failures should be distinguishable. One tests the MCP-facing input contract; the other tests application behavior after a valid request was accepted.
Capture three facts in the test record: the advertised schema, the exact sanitized arguments, and the observed result or error. Avoid pasting real access tokens or private ticket contents into bug reports. This record helps another developer determine whether a later failure came from a changed schema, a changed permission, or a genuine handler regression.
Inspector version and protocol version are two separate variables
A common debugging trap is comparing commands from two different Inspector releases while also changing MCP protocol versions. Inspector v2 changed its CLI behavior, process architecture and error exit codes; the July 2026 MCP specification separately changed the protocol lifecycle. A broken command can therefore be a client-version mismatch even when the server speaks MCP correctly.
Record node -v, the installed Inspector version, the server SDK and the protocol version the connection actually uses. The July 2026 protocol removes the legacy initialize/initialized handshake in favor of independent requests and optional discovery. A legacy client may still expect a handshake. Checking that compatibility boundary is more productive than repeatedly restarting the server with the same incompatible pair.
Do not assume that a connection through the Inspector browser UI and one through its CLI exercised identical configuration. The UI can retain server settings; an ad-hoc CLI invocation may omit credentials, environment variables or a working-directory override. When results disagree, compare their complete connection settings before concluding that one tool is unreliable.
Common mistakes when using Inspector
Testing only the happy path. If one sample call works, inspect how the tool handles missing required fields, unexpected types, and unavailable dependencies. A clear, bounded error is part of a dependable developer tool.
Launching a server with production credentials. Local MCP processes can inherit powerful secrets. Use a dedicated test account with narrow permissions, especially when inspecting tools that can write files, run commands, or change external resources.
Sharing the Inspector URL. The browser launcher uses an access token. Do not paste that URL into public issue reports or screenshots; redact tokens, authentication headers, and tool outputs containing private data.
Treating legacy transport examples as current advice. Older tutorials may focus on HTTP+SSE and older Inspector flags. Verify the protocol release and tool version before reusing commands from a blog post.
Assuming a tool-call result proves safety. Inspector shows what happened in a test. It cannot prove that a tool is properly authorized for every user, resistant to prompt injection, or safe to give to an autonomous agent.
When Inspector isn't enough
Inspector tests a server from the client's side. It does not replace structured server logs, tracing across downstream services, or authorization review. If calls involve money, data deletion, email delivery, or third-party APIs, you also need audit trails linking the user, token, tool name, input, and side effects.
For remote authentication failures, examine OAuth discovery and access-token validation, as explained in the companion MCP authentication article. A token meant for a different resource must not be accepted simply because it has a valid signature. That belongs in an authorization investigation, not in a generic “connection failed” checklist.
Confirm the repair, not just the connection
After fixing the fault, repeat three checks: list the tools, call a simple read-only tool with valid input, and call the same tool with a known-invalid input. Confirm that the valid call succeeds and the invalid one fails clearly. Record the Inspector version, server version, selected transport, and protocol version along with the outcome.
A green indicator is not enough. You want to know exactly which boundary was broken, why it failed, and what changed to make it work.
References
- MCP Inspector documentation, protocol version 2026-07-28: https://github.com/modelcontextprotocol/modelcontextprotocol/blob/main/docs/docs/2026-07-28/tools/inspector.mdx
- MCP Inspector project and current usage: https://github.com/modelcontextprotocol/inspector
- MCP specification update, July 28, 2026: https://blog.modelcontextprotocol.io/posts/2026-07-28/